
|
Graphs can tell more about data than words, and as a result, are a powerful tool for students to represent supporting information in their work. Not all graphs tell the same story, however, and students have to determine which type of graph best tells the story they want. As students learn the art of graphing, they can use some of the following tools to help in their selection of the best graph for the best storytelling.  Createagraph, a site sponsored by the National Center for Education Statistics, features the following graph types:
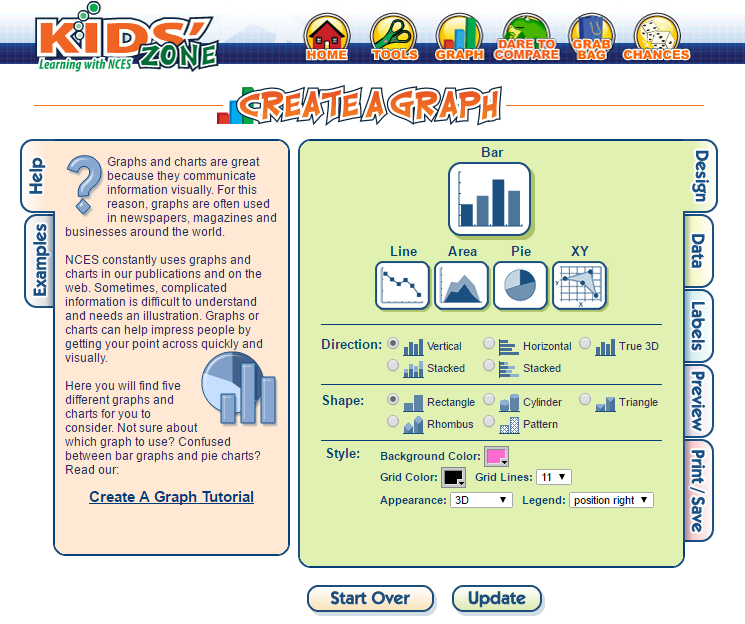 Students work their way through each tab, beginning with the Design tab to select the type of graph and style choices, then the Data tab to put in collected data, and finally the Labels tab to refine choices with data labels and fonts. The Preview tab allows students to view their final product, and if edits or revisions are needed, they simply click back to the previous tabs. The Print/Save tab is for either printing or downloading a JPG image as a final product. If downloading as a JPG image, this graph can be inserted into a presentation.  Illuminations, a site sponsored by the National Council of Teachers of Mathematics, has many options to support math instruction, but the two graphing tools are the Data Grapher and the Advanced Data Grapher. The Data Grapher is similar to Createagraph, with the ability to create the following graph types:
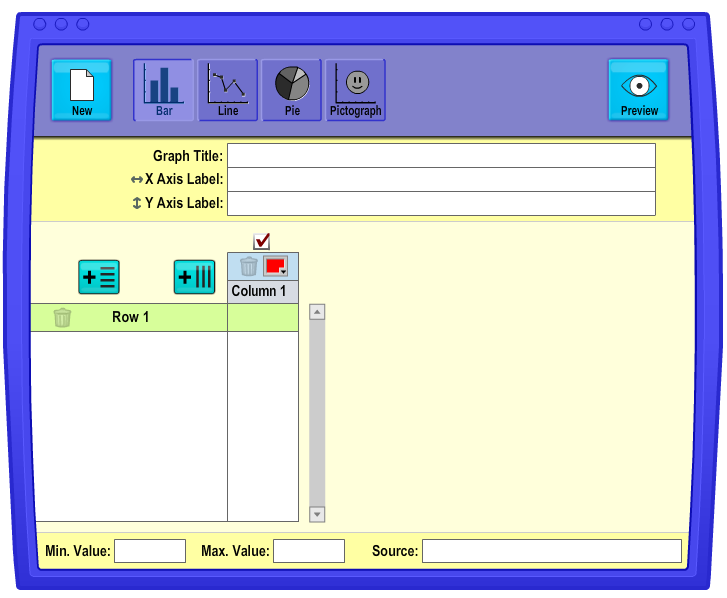 This tool may be more friendly for primary classrooms, with a simpler layout. Students can add more rows or columns with the click of the + buttons. Row and column text can be edited, so rows and columns can also be added by simply tabbing after editing text. 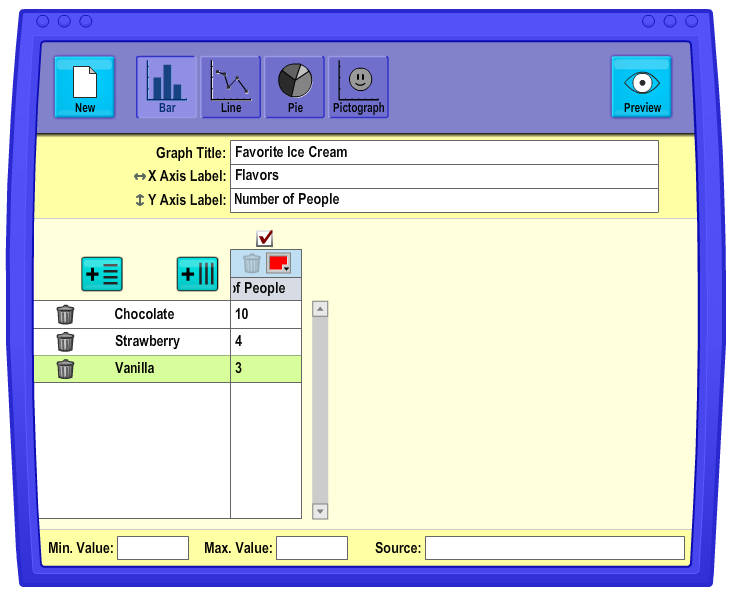 After inputting data, students click the Preview button to see additional editing tools. 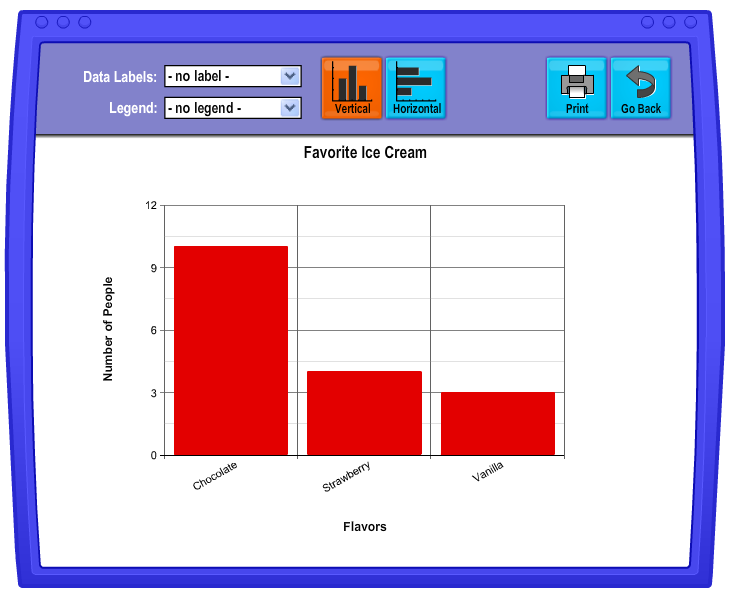 For intermediate grades, the Advanced Data Grapher on Illuminations’ site offers the following graph types:
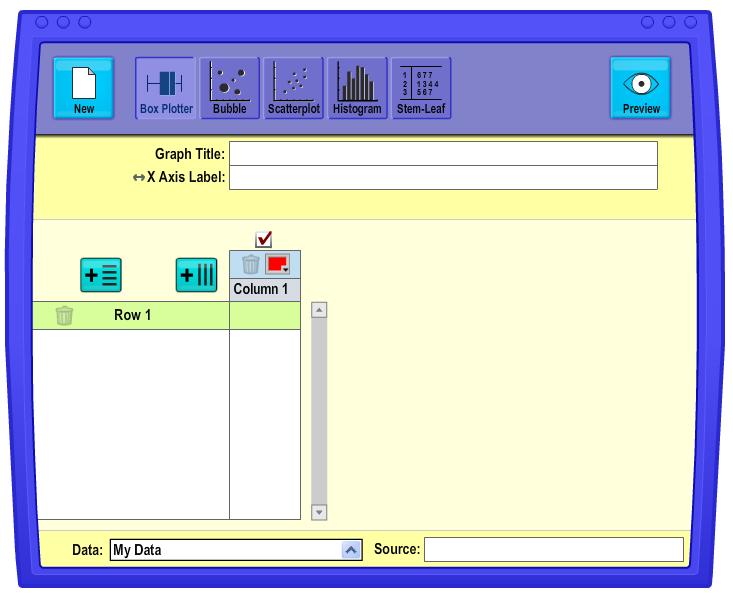 Similar in layout to the Data Grapher, many of the learned skills transfer well to using this tool efficiently. An added bonus with the Advanced Data Grapher, though, is the ability to use suggested data sets for Box Plotter, Histogram, and Stem-Leaf graph types, using the dropdown menu at the bottom of the graphing tool.
Encouraging students to not only read graphs but also to build their own graphical representation of data is an engaging task that promotes critical thinking and analysis. If you’d like further support, be sure to check in with your instructional coach or the tech coach for planning a lesson or project incorporating one of these options.
0 Comments
Leave a Reply. |
AuthorAs an instructional coach for technology, I get the pleasure of working with 1 preschool and 15 elementary schools to support integration of technology with classroom instruction. Archives
August 2020
Categories |
 RSS Feed